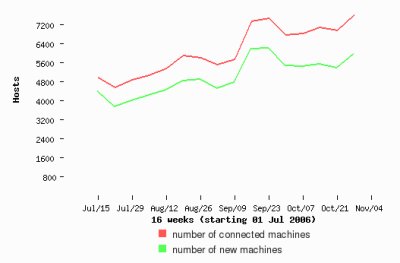
 Hosts Hosts
A graph show the number of hosts accessing your
website each week. The number of days is specified in the configuration file,
default is 50 days. The red bar is the number of hosts, the green one is
the number of new hosts from the beginning of the stats.
You can easily view more and more people are coming from weeks to weeks.
Graph can be displayed in four differents forms : lines, filled lines,
bar chart or 3D bar chart.
|
|
|
Weekly number of hosts
|
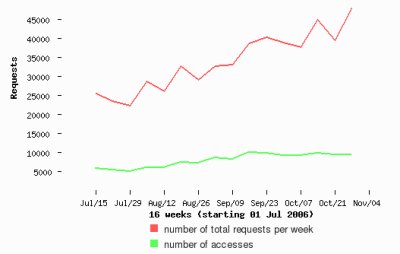
Same for requests and accesses
|
Hits, HTML pages and Domain hist
Each week, follow the growth of your website via the files downloaded.
In red, the number of hits is displayed, in green the number of HTML
pages and finally in blue, the accesses from the local domain.
Here, the graphic option selected is the line option.

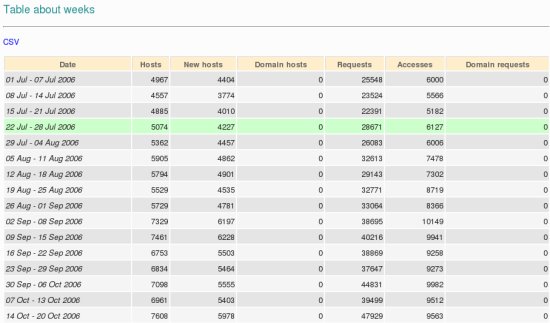
Textual weekly stats
A summary is availble if you need to print these informations.
Weekly reports
If you want to naviguate through the different weeks reports, you can
either use the calendar or select the week from the graph.
If you click on the graphic, full stats are provided for the week you
have selected. Depending your logfile structure, you can have the
complete list of hosts, countries, pages, directories, referer, agent,
and session stats.

Weekly accesses
|

|

Weekly menu
|

|

Weekly directories
|

Weekly traffic
|
|
|

Weekly referer
|
|