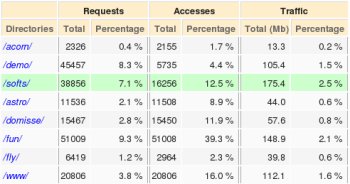
 List of selected directories List of selected directories
For each selected directories included in your configuration file, you
will get specific stats. Percentage give the relative access to your
differents directories. If domain stats is activated in the configuration
file, an extra columm is shown.
|

|

|
|
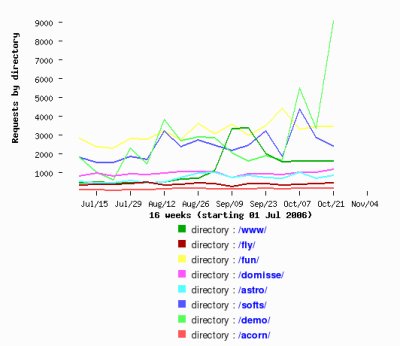
Stats for the selected directories
|
Requests for /demo/
|
Traffic for /demo/
|
Click on the link will bring you a page with two graphs for the
selected directory. The first one show the number of accesses versus
the last few weeks and the second the traffic used versus weeks. The graphs
can altered to be a line, a filled line, a 3D bar chart or a flat chart.
Directories stats
It is useful to know which part of your website is the most successful.
If your web is available in several languages and all the files are
located in their allocated directories (/uk/ for english, /fr/ for
french), you will be able to quantify uk versus french access.
Internal means the script count only files in the specified directory.
Global means it counts recursively including the files found in the
different subdirectories.
Each directories from the same level have the same background level to
allow a better view.
You can specify a seuil level to exclude from display low access
directory and thus reducing the download of this stats page.

|