 Real time Real time stats
Watch your stats in real time. Updates are computed every minute and you can change integration time (default is 60 seconds) and length (default 60 minutes).
Hosts are displayed with their pages list in chronological order.
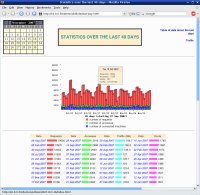
Follow your website activities on a scale time from hours to years.
On each daily/weekly/monthly/yearly report, list of
hosts/pages/directories/traffic/os/browsers/search
engine/referer/ ... /sessions are available !
Summaries and graphics will help you to have a precise snapshot of
your visitors.
|
|
|
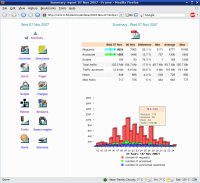
Daily stats
|
Countries for a specific day
|
Basic stats are computed, it includes which files have been red, how
long, how many times, from whom. Browsing into the hosts section will
allow you to get a in-depth look, from countries to domain to hosts to
host's pages. Table are sortable to make things easier to read and a
search tool allow to find in a click your data.
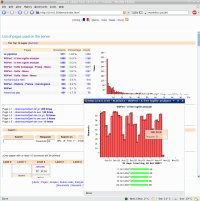
Map URL to document's title and statistics about your Web structure (tree, bad links...)
Tired to see URL in your stats report ? W3Perl map each file with its title tag found inside
the HTML code. Of course, it works if you put different title tag in your html document !
As a bonus, the script will also check links, report some stats about
your web structure (for instance, the lastest HTML files updated on your server).
Referer and agent statistics
These are important data as they provide you useful information about people visiting
your web. Where are they coming from ? From which pages ? What is the entry/exit point ?
What keywords people are using from search engine to reach your web ?
What is the ratio of Windows, Unix, Mac ? Which browser version are they using ?
|
Used with the broken links report, error stats are useful to track wrong links on your server.
Expected files requests from users are shown as well as access to forbidden server rules.
Hmmm...session stats can't be compute on the web as they are not 'ending session' flags.
But you can try to put some and check after processing that the rules you have applied are
right. Marks are the time for a user to read a HTML pages (you don't need more than 30 minutes
to read a HTML page), the time for a user to watch your web (usually
people don't stay on the same web more than 10 hours !).
Useful data as the average number of requests and time on your web can be extracted. Each
user is track and the report show you the HTML pages download, the time elapsed for these
pages. Watch and follow the exact user's path on your website ... URL by URL.
You are running a database on your server ? Well, W3Perl can show how often your
scripts are running. If you are sending parameters also, reports will show the occurences of these
differents parameters. It can display for instance if people are reading more often cars
advertising or computers ones.
If you want to add screen size and color depth stats to w3perl, you need to add a small piece of javascript within your most popular webpage. This javascript will detect screen size and add this informations in your logfile so W3Perl will be able to read it.
Login stats for restricted directories
You have a protected area in your server and you want to watch out people accessing to
these area ? Yes, you can ! The script will show who, when and what file have been
accessed by your authorized users.
|

|
|
Pages stats
|
Directories stats
|
|